Introduction
A property developer planning its next annual report must weigh how much emphasis sustainability carries against the balance sheet. Avaland Berhad brought that question to its 2024 corporate annual report, and Walk Production oversaw conceptual development, visual and layout design, and editorial support across the publication.
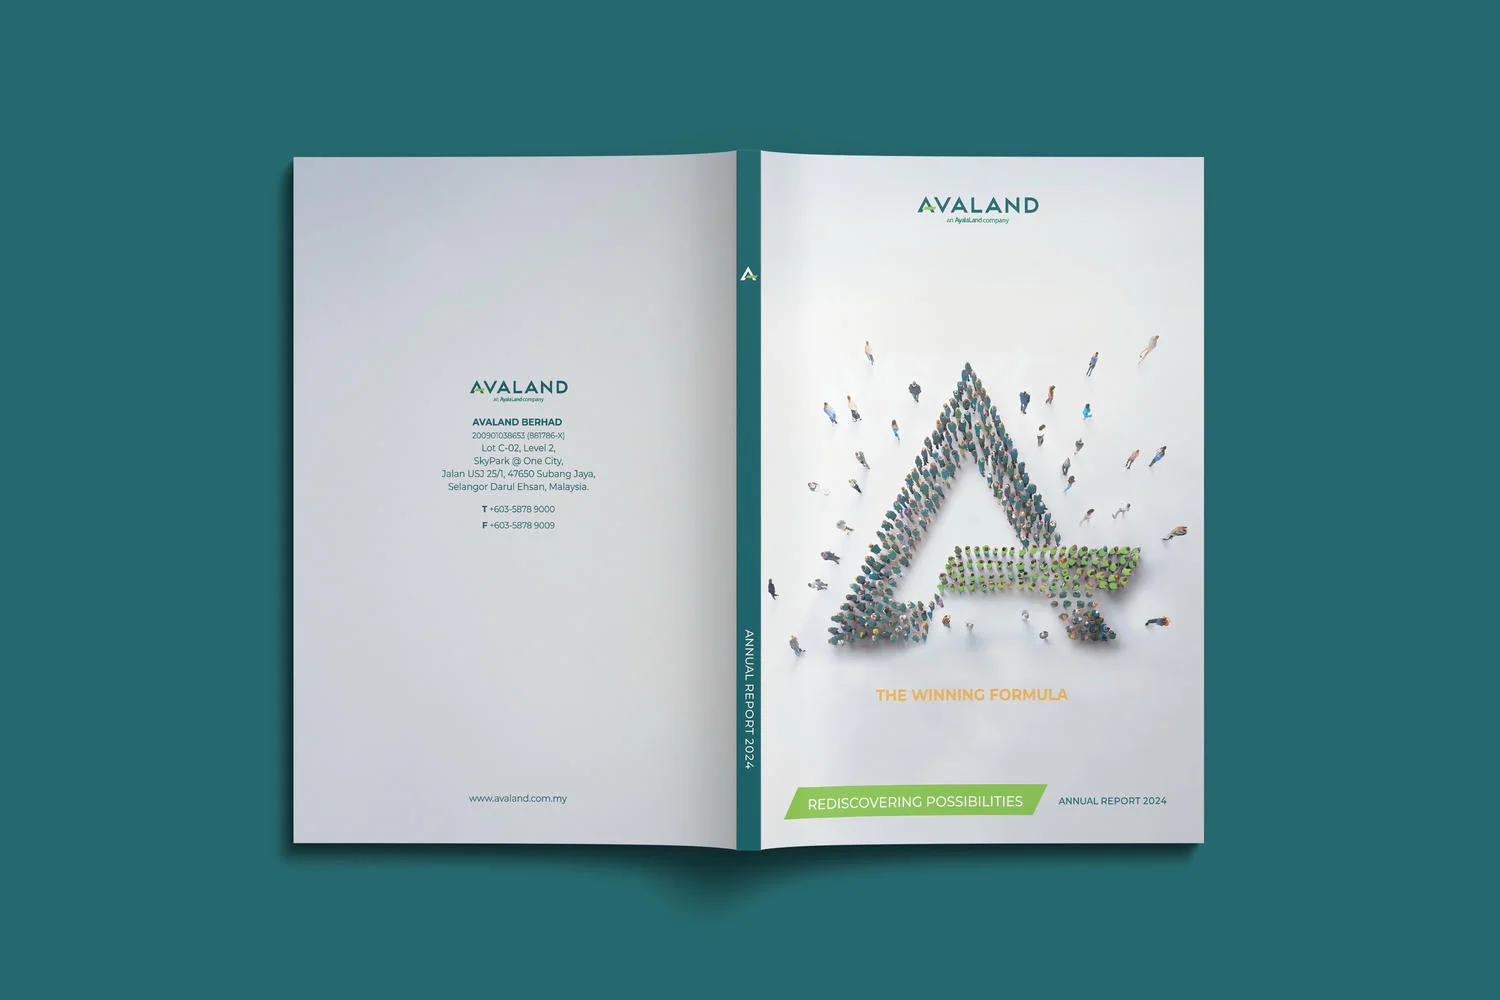
The brief centered on presenting corporate performance, development activity, and sustainability content in a clear reporting format. Shareholders lose the thread halfway through when that balance is wrong. Property groups across the UAE and wider GCC have to strike it too, because free zone and onshore investors arrive with different questions. Walk Production built the corporate annual report around the theme The Winning Formula, with a cover that arranges crowds of people into the letter A, a reference to the Avaland name and to the collaboration behind the year’s results. The structure gives readers a consistent path from highlights and leadership through the sustainability statement to governance and the financial statements.
Our Solutions
Conceptual development and visual direction
The report was built around the theme The Winning Formula. The cover arranges crowds of people into the letter A, connecting the Avaland name with the collaboration behind the year’s results, set on white above a green Rediscovering Possibilities band.
Inside, the report runs from highlights and leadership through management’s perspective and the sustainability statement to governance and the financial statements. Deep teal section pages and architectural photography of the group’s developments carry readers between chapters.
Layout design and content structure
The layout guided readers through operational highlights, sustainability-related updates, and financial data in a logical flow. Each section used clear headings, data callouts, and supporting imagery to maintain engagement across both corporate and technical content. Section transitions were designed to create a smooth reading experience between quantitative financial data and qualitative narrative commentary throughout the publication.
The narrative was structured throughout the publication layout, connecting project milestones with the company’s stated direction. Property showcase pages featured approved development imagery alongside key specifications and project information, linking individual projects to the wider reporting narrative.
Data visualization and report writing
The editorial team developed infographic content that combined financial data visualization with written narrative to make complex corporate data easier to read. Financial highlights, ESG metrics, and development portfolio data were presented through custom charts, comparison graphics, and visual summaries. Each data element was designed to communicate key performance indicators at a glance while supporting deeper analysis for institutional readers.
Copywriting and proofreading services supported content accuracy and consistency throughout the report, with particular attention to sustainability disclosures and financial commentary. The editorial process covered the management discussion, chairman’s statement, and operational review sections. The narrative was written to keep the company’s stated commitments aligned with its reported performance outcomes for the financial year.
The Results
The completed annual report communicates Avaland’s sustainability progress and financial performance through a professional format that supports investor confidence and stakeholder engagement. The publication presents development activity alongside corporate governance disclosures in a structured and accessible document designed for diverse reader groups.
The report combines creative direction with a clear editorial narrative, presenting the company’s reported activity and results across all sections of the publication. Connecting the group’s collaboration theme with its financial results, the report supports shareholders, analysts, and industry observers reviewing the company’s annual progress.
Related Questions
Why is sustainability important in property development annual reports?
Sustainability reporting helps a developer present environmental, social, and governance topics alongside financial performance. Investors and regulators increasingly review these disclosures when assessing companies. A clear annual report gives readers the context they need to understand the company’s stated sustainability priorities, development activity, and governance approach.
What does infographic report writing involve?
Infographic report writing combines data visualization with editorial content to present complex information in accessible visual formats. The process involves translating financial and operational data into charts, graphics, and illustrated summaries while developing supporting narrative. Writers and designers collaborate closely to connect data points to corporate strategy, creating content that serves both technical analysts and general stakeholder audiences effectively.
How does annual report design support investor relations?
A professionally designed annual report builds credibility and communicates corporate transparency to existing and potential investors reviewing the company. Clear presentation of financial data, strategic direction, and operational highlights helps investors assess performance and growth potential. Consistent visual identity and structured layouts demonstrate organizational discipline that reinforces confidence in the company’s management quality and governance standards.
What is included in editorial services for annual reports?
Editorial services typically cover annual report copywriting, content editing, proofreading, and fact-checking across all report sections and supporting materials. For annual reports, this includes financial commentary, management discussion, operational reviews, and sustainability disclosures. The editorial team maintains consistency in tone, terminology, and factual accuracy throughout the publication before final approval and file handoff.
How does visual design enhance corporate reporting?
Visual design turns dense corporate data into structured, readable formats for technical and non-technical audiences. Professional typography, color systems, and layout hierarchy help readers navigate complex content across financial and operational sections. Infographics make corporate data easier to understand, while imagery and graphic elements support sustained reader engagement throughout the publication.